Measurement of straight and curved fibers - Newsletter May 2018
The JEC world in Paris has shown us how diverse the possibilities in the world of composites and innovation are. It was great to be part of it! This year's JEC made it even more visible that the demand for natural fiber reinforced polymer composites as well as carbon fibre reinforced composites are growing. The use of recycled carbon fibers and milled natural fibers shows us that the analysis of fibers is crucially important.
FibreShape has not only the function to analyse the length and thickness of fibers but also to apply shape filters and to select and measure for example only curved or straight fibers. You find more about shape filters in the category "Products".
Sincerely
Your IST AG
Literature note:
Müssig, J. & Amaducci, S. 2018: Scanner based image analysis to
characterise the influence of agronomic factors on hemp (Cannabis sativa
L.) fibre width. In: Industrial Crops and Products (ISSN 0926-6690),
Vol. 113, March 2018, pp. 28 - 37 .-
https://doi.org/10.1016/j.indcrop.2017.12.059
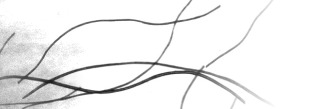
- How to measure only straight flock fibers using a shape filter? Here some hints!
Example 1 of fig. 1 shows a flock fiber (red dot) which is relatively straight (Solidity: 0.77) and example 2 shows flock fibers with a strong kink (Solidity: 0.21). Example 2 shows a selection of flock fibers where two individual flock fibers touch each other and have been detected as a single fibre due to the shallow angle at which they touch. Accordingly, flock fibers of twice the length are also included in the corresponding length histogram (see fig. 2).
To eliminate these "false positives" you can set a shape filter on the Solidity parameter.
A histogram of the Solidity parameter comes in handy to select a threshold value for the shape filter. In our example, a good threshold value is 0.6 (see fig. 3).
Fig 2: Length Histogram (without Solidity Filter)
Fig 3: Histogram Solidity
Fig 4: Accepted and rejected objects
Fig 5: Length Histogram of Straight Fibers
The effect of using the shape filter Solidity can be seen in fig. 4 and fig. 5.
- The version 6.1.4 is released. The latest version permits you
- to change the parameters of X- and Y-axis of your histograms such as number of ticks and number of decimals
- to display from the software accepted and rejected objects
With the new version your results can be presented even more concrete and clear. (see fig. 4) - to change the parameters of X- and Y-axis of your histograms such as number of ticks and number of decimals
- June 12, 2018 (Denkendorf, Germany): AFBW Event: Sitzung der AG Recycling
- October 15-16, 2018 (Shanghai, CN): 55th Meeting ISO/TC 24/SC 4 N 925
